
Why is The Globe and Mail Publishing Delusional Assessments of the Economy? And why is a Finance Professor Writing them?
There’s another, more accurate interpretation of what’s wrong with the global and Canadian economy, as unpacking George Athanassakos error-filled piece shows.

On August 29, The Globe and Mail, Canada’s “paper of record” ran a special report by George Athannakos, a professor of finance with extensive experience, as his bio at the Ivey Business School shows.
https://www.ivey.uwo.ca/faculty_research/directory/george-athanassakos/
His piece, is entitled “Higher taxes and inflation are coming. This is how investors should prepare for it,” is filled with sweeping generalizations unsupported by facts, statements and theories that are flatly contradicted by evidence and observation.
The assumptions that Athannakos is making are so dense that a single sentence can contain multiple assumptions that take paragraphs to unpacked and debunk - starting from the very first, where he writes:
“Free trade and globalization over the 30 years prior to 2022 made citizens of every nation around the world richer, particularly those in advanced economies.”
It’s amazing that a statement that is so apparently simple could be so slippery.
In fact, it’s incredibly deceptive, because it combines multiple assertions, not one of which has any measurements. The problem isn’t that he’s moving the goalposts, but that he’s using portable ones.
He starts with a broad assertion about “free trade and globalization” being the reason for major economic change.
Is free trade supposed to be the only reason? There are other major forces in the economy, from oil cartels to central bank monetary policy, which have multi-trillion dollar impacts on economies. Are they being taken into consideration? We don’t know.
The same lack of definition applies to the number of citizens. How many citizens from any nation are richer? Is it all, some, a few, or one or two per country? We don’t know.
The term “richer” is also purely relative. Richer by how much? Technically, the answer is a range of values from plus one Canadian cent up.
Realistically, we don’t know.
On more than one variable, the +/- ranges from as close to zero as you can get (without going negative) to the maximum number possible. Because there is no way to measure any of these claims, the entire sentence is meaningless.
This matters, not just because Orwell argued that a lack of clarity in writing betrays a lack of clarity in thought.
Given the information in the sentence, a reader could reasonably interpret it as meaning “most citizens in developed nations are richer because of globalization and free trade,” which would not be accurate.
For decades, the vast majority of growth in the economy has been massively concentrated in the hands of very concentrated minority of the population, including in developed countries. The majority of the population in developed nations have seen their incomes stall and decline, with globalization and the normalization of trade with China, in particular, having a major impact.
The distribution of the growth in “riches” has been colossally uneven.
In 2012, Economist Branko Milanovic published a chart showing changes in global incomes since 1980. Named an “Elephant Chart” after its shape, the “head” shows growth in developing world incomes (largely China); the dip of the “trunk” shows little or no growth for middle- and working-class incomes in developed countries, then picks up again for the super-wealthy few at the very top.
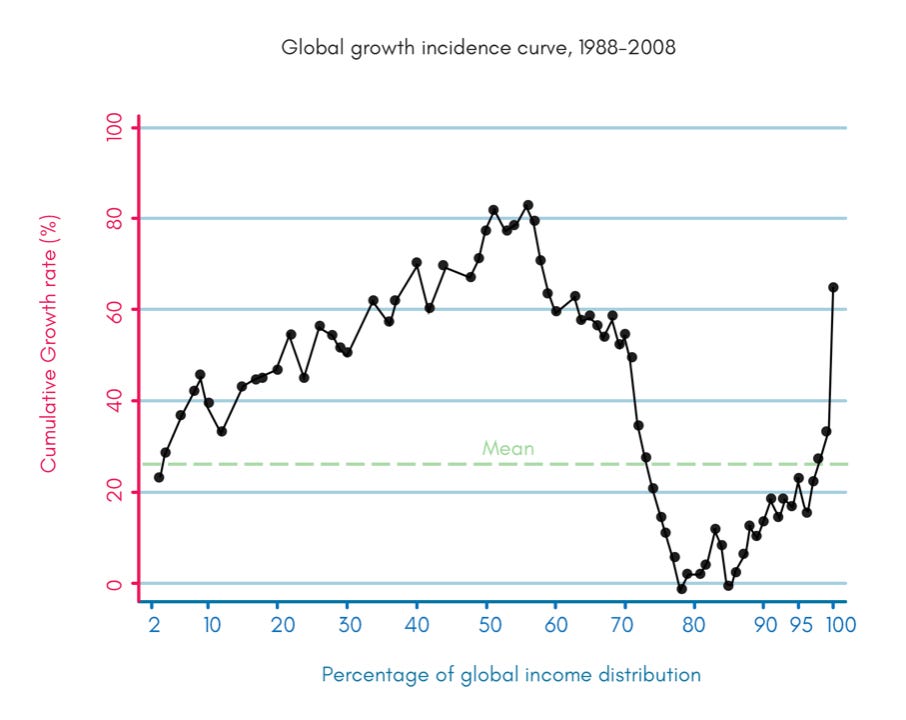
The chart doesn’t consider starting conditions, which in India and China meant hundreds of millions of people who were earning less than $2 a day. 60% growth in China meant hundreds of millions of poor people went from making $2 to $3.20 a day. A decade ago, the new “global middle class” in China and India was making $5 to $15 international dollars a day per household.
Many citizens in advanced economies, including the U.S. and Canada have seen income stagnation for decades, since the 1970s. A decade ago, economist Miles Corak wrote of Canada wrote that “The typical household is now no better off, indeed about $3,000 worse off, than it was in the mid- to late-1970s, in spite of 35 years of economic growth.”
Writing on the 20th anniversary of NAFTA, Brad Delong, a U.S. Economist who worked on the deal said, “The most important aspect of NAFTA was the Mexican financial liberalization that allowed Mexico’s rich to cheaply purchase political risk insurance from Wall Street by getting their money into New York.”
http://equitablegrowth.org/debate-tpp/
In 2016, a study mentioned in the Economist showed that North American manufacturing had been devastated by trade with China in a way that no economists in the 1990s foresaw. The downside was mainly in the U.S., but also in Canada and Mexico. Paul Krugman, whose area of expertise is international trade, predicted that it would have few effects. He was wrong.
“[David Autor of MIT, David Dorn of the University of Zurich and Gordon Hanson of the University of California, San Diego] found in a 2013 paper, competition from Chinese imports explains 44% of the decline in employment in manufacturing in America between 1990 and 2007. For any given industry, an increase in Chinese imports of $1,000 per worker per year led to a total reduction in annual income of about $500 per worker in the places where that industry was concentrated. The offsetting rise in government benefits was only $58 per worker. In a paper from 2014, co-written with Daron Acemoglu and Brendan Price, of MIT, and focusing on America’s “employment sag” in the 2000s, the authors calculate that Chinese import competition reduced employment across the American economy as a whole by 2.4m jobs relative to the level it otherwise would have enjoyed.”[1]
This happened because U.S. and other North American companies simply shifted production entirely to China, or another ultra-low wage juridiction, which meant significantly increased profits for the company, executives and shareholders.
None of this should be surprising, much less controversial: it is accepted that free trade will mean that some people will lose and others will gain. There’s usually some lip service about assistance or job retraining, but the reality is like the $58 in assistance above: next to non-existent.
Economists and politicians should all know that trade deals have winners and losers. The idea is that we’re all better off, so long as some of the growth from trade is used to compensate the people hurt by the deal. Instead we get the “Free-Market Economist Two-Step”.
FME: Trade policy X will make us richer on aggregate
Other: What about winners and losers?
FME: Policy can be created to compensate the loser.
Other: Sounds good, here’s a policy we could use?
FME: Redistribution is distortionary, this cannot be allowed!
As per The Economist:
“Economists have long accepted that this overall boost to prosperity might not be evenly spread. A paper published by Wolfgang Stolper and Paul Samuelson in 1941 pointed out that trade between an economy in which labour was relatively scarce (like America) and one in which labour was relatively abundant (like China) could cause wages to fall in the place that was short of workers. Yet many were sceptical that such losses would crop up much in practice. Workers in industries affected by trade, they assumed, would find new jobs in other fields.
For a long time, they appeared to be right. In the decades following the second world war, rich countries mostly traded with each other, and workers prospered. Even after emerging economies began playing a larger role in global trade, in the 1980s, most research concluded that trade’s effects on workers were benign. But China’s subsequent incorporation into the global economy was of a different magnitude. From 1991 to 2013 its share of global exports of manufactured goods rocketed from 2.3% to 18.8%. For some categories of goods in America, Chinese import penetration—the share of domestic consumption met through Chinese imports—was near total.” [2]
Globalization and free trade and deregulation have fuelled the de-industrialization of developed countries, and fuelled the evergrowing mergers and acquisitions which ultimately means less competion and higher prices and profits, because concentration of ownership translates into concentration of bargaining and pricing power.
There have been some very big winners and many losers from trade. Not all citizens in Canada are richer as a consequence, and this has been a concern for two decades.
There is other data from over a decade ago showing that the benefits of growth weren’t reaching Canadians, even in Alberta at the peak of its oil boom just over a decade ago.
In 2013, an economist at the City of Edmonton reported that when adjusted for inflation 99% of wage earners in that city hadn’t seen an increase in their incomes in more than 30 years, and in Calgary, it was worse.
In Calgary, wages have actually declined. The vast majority of people in Calgary can buy less with their paycheque today than they could in 1982, said John Rose.”
This was during a time where the price of oil had steadily been rising for over a decade and was $100 a barrel, before Saudi Arabia crashed the price of oil in 2014.
Before the crash, in 2014, it was determined that Alberta’s had a higher concentration of wealth than the U.S: 50% of all the income was being earned by 10% of the population, so the reverse is true as well: 50% of the income is being divided up among the other 90% of the people, and the division is anything but even - the higher you go, the higher the income gets.
Some of this is just because of the nature of the oil industry: it’s incredibly capital intensive and so automated that the work doesn’t take that many people to do.
About a decade ago in Alberta, 139,000 people, or 7.1% of the population worked directly in the oil industry; they produced 25% of provincial GDP, 33% of the provincial government’s annual revenues, and 50% of the province’s exports. Alberta’s economy grew quickly since 2000 because the price of oil has increased, but between between 2000 and 2009 (though this includes a sharp recession after 2008) Canada as a whole lost 500,000 manufacturing jobs.
These manufacturing jobs have not been replaced, and there are many people who have lost out as a consequence of free trade and globalization, whether it is in finance or in competition from China.
How could Athannakos think otherwise? Because he is operating on the premise that, so long as total GDP grows, it is a gain for all, when it is not.
Talking about the distribution of wealth and income has been actively discouraged by leading economists. Robert Lucas, who is one of the architects of the 1970s neoclassical economic revolution said, in 2004, “Of the tendencies that are harmful to sound economics, the most seductive, and in my opinion the most poisonous, is to focus on questions of distribution.”
This is really just an ideological taboo that has successfully discouraged the economics profession from analyzing concentrations of income and ownership. This doesn’t make sense, just from the point of view of wanting to get an objective picture of income and wealth is concentrated.
It makes even less sense when such research and information is used to inform the entire way that organizations and corporations plan and execute their business strategies in ways that have profound effects on the economy.
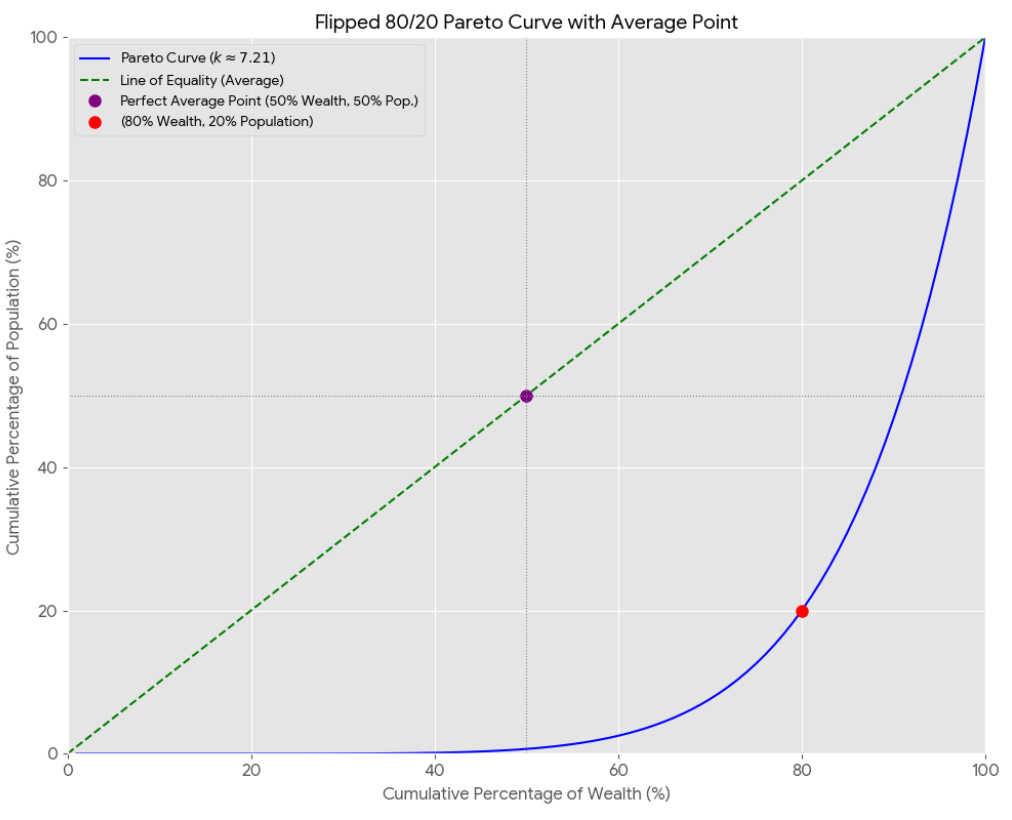
The problem is that none of the commonly used indicators are close to capturing the actual curve of the line, which is not a bell curve. It is a curve that slopes up gently for the vast majority of the population, then takes a sharp turn upward, like a hockey stick.
Most measures of econoomic inequality -all fail to convey the massive disparities in income and wealth concentration that are associated with distribution based on a power law.
The 80:20 rule, is generally absent from economics and politics but is taught in introductory business and marketing classes. The idea is that 80% of your income will come from 20% of your customers, so as an entrepreneur or business owner, you want to put your energy and efforts into the 20% of customers who make you money, not the 80% who don’t. This is now reflected in all kinds of “dynamic pricing” that effectively make it cheaper to be well off, and more expensive to be worse off, because business will compete for the custom of the top 20% with 80% of the income and compete to avoid the 80% with 20% of the income.
It’s known as “Pareto’s Principle” and, like Pareto’s concept of efficiency, generally leaves out that Pareto was a major inspiration to the development of fascism and was appointed to the Italian Senate by Mussolini.
The shape of the power law curve breaks these other mathematical approaches, because it 80/20 law is recursive. The top 20% of the top 20% will have 80% of the 80%.
What this means when you let the math run its course is that, in a given economy:
0.01% owns 40% of the property
0.64% owns 11% of the property
3.2% own owns 13% of the property
16% percent own 16% of the property
80% of the population own 20% of the property
This is where the talk of the 1% comes from, even though the very top 0.1% owns many times as much property even than the rest of the 1%. The top three quarters of one percent of the population owns over 50% of all the property. The top 4% own 64% of the property. Then 16% own in proportion to their population.
Under this distributon, the average difference in wealth between the bottom 80% and the top 0.1% is 500 to 1 - a proportion recognized by Adam Smith: ‘Wherever there is great property there is great inequality. For one very rich man there must be at least five hundred poor, and the affluence of the few supposes the indigence of the many.’ (Smith, 1776, pp. 901-902)
The fact that income and wealth is divided up according to this power law means that if you try to take an average, or a median, it won’t work.
To be clear, the actual distribution follows this power law, and we have the data to show it. If you try to determine the average or the median, it will generate an answer that lies outside the observed data, which is incredibly granular, because it is based off Statistics Canada data from millions and millions of annual tax returns.
The common argument about this pattern of distribution - including from Pareto - was that it is something natural, and often that it about natural superiority, when it is a consequence generated by rules of a human game, where the choices of others can make or break your chance of success.
Different economies have different distributions - In Canada, the top 20% owns about 67% of all the property. In the 1970s, the average CEO made 25 times what the average worker made. Now it’s over 300, and sometimes as high as 500.
The idea that it is “natural” suggests that it is unnatural to oppose them, when the opposite is true: the pattern is the outcome of a probability distribution that would only play out as it does with random chance.
I used Google Gemini to show the math formulas that generate and graph an 80/20 power law distribution. It’s not a “power law” in terms of having power, it is power as in when you raise a number “to the power of x” by multiplying a number by itself x number of times.
“Deriving the Exponent (k)
To find the specific formula for the 80/20 relationship, you first need to solve for the exponent k. This is done by taking the logarithm of both sides of the main formula:
log(y)=k⋅log(x)
k=log(x)log(y)
By substituting the 80/20 values into this equation, you get:
k=log(0.20)log(0.80)
This calculation yields an exponent k of approximately 0.14. Therefore, the formula for the 80/20 relationship of property to population is y=x0.14.
In Canada, the proportion is closer to 67/20
“By substituting the new values, the calculation is:
k=log(0.20)log(0.67) ≈0.25
Therefore, the formula for a 67/20 relationship is y=x0.25.”
The thing is, it’s what happens when you graph the formulas that really tells the story. This is what Canada’s income inequality looked like - like the “hockey stick” curve that power law formulas generate.
The gains - including in Canada - have been overwhelmingly concentrated at the top, and in the financial sector, who have seen their wealth and incomes grow as industrial capital and workers have stagnated and lost out.
It is more accurate to say that globalization and free trade have accelerated the concentration of ownership and income in the hands of a few, as most citizens are worse off, especially in developed countries.
Now, at this point, I’ve only unpacked and illuminated what’s wrong with the first sentence of Athannakos’ piece.
If you’re dismayed, well, so am I, and I hope to make quicker work with the rest of it.
He continues:
“A report by Credit Suisse Research Institute indicated that there were 59.4 million high-net-worth individuals in the world in 2022 (namely, those with wealth between US$1-million and US$50-million), up from 29.6 million in 2011. North America accounted for 42 per cent of the total, while Europe accounted for 27 per cent.”
This spike in high-net worth individuals is inseparable from a massive credit-fuelled explosion in the price of assets - a massive asset and real estate bubble that is collapsing. Ultra-low interest rates and trillions in quantitative easing by the federal reserve and trillions more by other central banks around the world fuelled a massive explosion in speculation in stocks and real estate. Investor and self-made billionaire Jeremy Grantham has spelled it out, based on the simple principle of reversion to the mean. Grantham has said even a partial reversion to the mean could mean $35-trillion in losses, the largest loss of perceived wealth in history.
“In the process, and driven by low interest rates, consumer borrowing increased to record levels.”
There is lots that Athannakos is ignoring here. First, interest rates were deliberately lowered as the Bank of Canada’s response to major shocks to the Canadian economy. It’s intended as “monetary stimulus” The official policy for decades has been for central banks to stimulate the economy by lowering interest rates, specifically so that private individuals and households will take on more debt to stimulate the economy.
Lower interest rates mean that people can service more debt with less money - which means larger and riskier loans across the economy, which tend to be used to bid up the price of existing, non-productive assets, not investing in the creation of new value and productive assets.
Exactly the same factors driving the global financial crisis are still at work.
All that private debt is someone else’s investment. The whole trick of the economy is just how many of those high-income people became high-income people based on ordinary folks taking out colossal debt.
The investment that pays off big is the mortgage, not the house. The house will cost you money. The lender will double their money on your mortgage.
As Steve Keen recently put it “This is disastrous for first home buyers—and young people in general—because they have to service the higher levels of household debt, while the people selling to them—overwhelmingly Baby Boomers—get to pocket the capital gains from higher prices.”
“Governments around the globe also borrowed extensively to pay handsome wages and rich benefits and other support or transfer payments.”
This is simply false, and ignores three of the most disruptive economic shocks in history over the last 20 years: the Global Financial Crisis (including the Euro crisis); the 2014 Saudi-OPEC price war, and the pandemic. The “handsome wages” for tens of thousands of Canadian workers don’t exist. In Manitoba alone, thousands of unionized public sector workers don’t make a living wage.
“In addition to record borrowing, the 2008 credit crisis hit advanced economies hard with huge amounts of debt transferred from overleveraged individuals and businesses to the government.”
Once again, Athanassakos is blurring lines. Reading this sentence, it would appear that “the government” took on the debt from people and businesses who had borrowed too much. This creates the impression that the government went deeper into debt to help ordinary people and businesses who had borrowed too much, all of which is false.
After the dot.com crash and 9.11, the U.S. Government, Federal Reserve and the financial sector, all contributed to the cultivation of a massive asset bubble through deregulation and low interest rates, which were fuelled by widespread fraud and criminality on the part of investors. People looking to borrow were denied safer mortgages they qualified for, and were persuaded or swindled into taking on debt with worse terms, because it led to greater short-term profits. Borrowers were abandoned, went bankrupt and lost their homes in the millions.
The people who were rescued were not the people who couldn’t pay bad loans - the rescue was for the people who made them in the first place. All those debts and liabilities are also assets, and the money to buy those assets wasn’t from the elected, fiscal side of the federal government, it was from central banks creating money out of nothing. The Federal Reserve and other central banks created trillions of dollars in new money through “quantititative easing” and that new money was given to investors in exchange for their so-called “toxic assets”.
One of the reasons for why governments did not go into deficit, but that central banks creates new money in this situation was that the financial sector had no money to lend. The private sector did not have money to put into U.S. government bonds, because so many of their sources of current and all future revenue were collapsing due to mass defaults. The private sector’s risks gone wrong had destroyed their money, so central banks had to create it, which they have the exclusive power to do.
Athannakos writes:
“Public debt expanded further through the various stimulus programs during COVID.
Some figures from Canadian and U.S. government sources help put this into perspective. In 2000, Canada's public debt was US$426-billion, public debt per person was US$13,948 and public debt-to-GDP was 59 per cent. The corresponding figures for the United States were US$5.7-trillion, US$20,836 and 31.2 per cent, respectively.”
Fast forward to 2022. Canada's public debt had risen to US$1.67-trillion, public debt per person had more than doubled to US$41,794, and public debt-to-GDP stood at 86 per cent. The picture in the U.S. was staggering, with public debt at US$30.27-trillion, US$93,518 in public debt per person and public debt-to-GDP at 112 per cent. And public debt outstanding has risen further since then in the U.S., while it has improved somewhat in Canada, but still remains at historically high levels.”
These perspectives are all meaningless: the only perspective that matters is whether people and institutions have the capacity to manage the debt, including under crisis conditions. Because they can create money, governments do, and because the private sector cannot, they don’t.
As the actions of central banks in the GFC and the pandemic show, that government has the power to create money in a crisis. It does not have to borrow, or tax for it. Government, and government alone, has the authoriy to create currency. That is in Canada’s constitution. Governments collect taxes in their own currency, so citizens have to get the currency from government before they can pay it back.
The actions taken by governments during Covid were not to stimulate the economy into growth, but to prevent its total collapse. Early in the pandemic, lending markets locked up and central banks once again engaged in quantitative easing - printing billions and trillions of dollars in newly created currency that was given to investors and lenders in exchange for assets, so the investors would lend more. The explicit policy of government and central banks was to encourage private citizens and companies to go further into debt in order to keep the economy afloat.
The idea that each individual citizen is personally responsible for an equal share of the public debt is completely false. No citizen will ever be on the hook for that money on an individual basis. It is totally false to suggest that responsibility for this debt is shared in this way.
Using a “per capita” calculation is just taking an average, and as I pointed out earlier, you cannot take an accurate average when real-world distribution reflects a power law. The math does not math.
As a citizen, your contribution to paying off this debt is directly proportional to your income and taxes. The less you make, the less you owe, the more you make, the more you owe.
Governments don’t retire, die or leave inheritance. The debt is spread across an entire and varied population, and over decades. It is not like a mortgage, a line of credit. It is bonds, each with their own amounts, terms, and interest rates, and they are being paid down all the time.
“No matter how you look at it, public debt and public debt per person have skyrocketed around the globe, particularly in advanced economies - this does not include private debt, which has also exploded. And all this is happening while luxury home and luxury car sales are booming, according to recent reports by The Agency and Scotiabank, respectively. Result: wealthy citizens, but not-so-wealthy countries.”
It’s not the “country” that is poor, it’s that the ownership and income is much more concentrated than it used to be, and debt is much worse. And because the many can no longer afford to own, they rent - which means they are continually adding to the owner’s wealth, not their own.
“Economies and countries around the world have now reached a wall. Public debt cannot continue to climb in this fashion - especially in times of economic prosperity. Governments know this. But does it matter that governments have too much debt on their balance sheets? Yes, it does. Higher debt levels increase the risk of fiscal crises (what if there is a recession?) and hurt economic growth. Public debt must be paid down.”
None of these assertions are backed up by evidence. Monetarily sovereign governments that take deposits for bonds in their own currency are at zero real risk of default. In the last 15 years, central banks have created trillions of dollars in public money and used it to bail out investors’ bad bets. Since 2014 there has been an explosion in research into the causes and reactions to the Global Financial Crisis and the Euro Crisis that make it clear that the austerity never works, and why.
Those crises were not caused by government debt, they were caused by private debt that exploded because governments were running balanced or surplus budgets. Many governments - Canada, the US and even Greece - were being praised for balancing budgets or running surpluses, which meant investors put money into buying higher-yield, higher risk mortgage-backed securities instead of safe government bonds.
What Athanassakos and others are ignoring is the absolutely basic statement of accounting:
When government runs a deficit, they are spending more into the economy than they are taking out, which is a surplus for the private sector.
If the government runs a surplus to pay down debt, it means the private economy is in deficit.
That is just one of many reasons austerity is doomed to fail. Adair Turner, an academic who was Chairman of the UK financial authority, wrote an outstanding book, “Between Debt and the Devil” that explains in detail the theoretical failures and assumptions that helped create the Global Financial Crisis.
We are not in a time of widespread economic prosperity. We are in a massive bubble.
“But how? One option is by raising taxes — thus transferring wealth from rich citizens to poor governments. We have heard a lot around this issue recently in the U.S., and Canada, but in the opposite direction, namely, governments have promised to reduce taxes rather than raise them.”
Here, Athannakos is correct about governments choosing to cut taxes rather than raise them, but framing it as “transferring wealth from rich citizens to poor governments” ignores that trillions of dollars in public debt in the US, and hundreds of billions in Canada, is because “poor governments” have running deficits to pay for unfunded tax cuts for “rich citizens”. This is a way for “rich citizens” to pay off the public debt from which they directly benefited.
“Another option to rein in debt is to cut spending. And finally, another option is to fire up the money-printing presses and, in the process, create inflation and reduce public debt in real terms.”
Athannakos is here invoking Milton Friedman, whose theory of inflation is really just a thought experiment, that is contradicted by observed reality. When Athannakos and other economists refer to “money printing,” it would seem to imply that the government is creating money in order to pay for government spending or investment, which is completely inaccurate.
What economists call “money printing” “Money printing” is not the government or the central bank creating fiat money and spending or investing it into the economy, without any interest attached. It is when central banks lower interest rates, and commercial banks extend more private credit as loans.
“In my opinion, governments will try to tax to the max, either directly via income tax changes or indirectly via tariff increases or via increasing consumption taxes. And all this at a time when non-payment of taxes has become a continuing problem around the globe.
While Greece has received most of the negative publicity about its inability to collect taxes, wealthy people in Germany and Britain hide much greater sums from tax authorities, according to the Boston Consulting Group. But it seems that baby boomers want to hold on to what they have, and they do not want to share it with others in their societies. Our mistrust of the government may have to do with efforts to hide taxes from the taxman. Will higher taxes (direct or indirect) achieve the necessary increase in revenues to balance budgets and start reducing debt levels? There are many views on that, but no consensus.
Governments will also try to cut spending. Good luck with this, too. Looking around the world, the U.S. and Canada included, one can see how resistant people are to cuts to their entitlements and how difficult it is to cut the bloated public sector - and military spending is set to jump around the world rather than decline. We are seeing daily the kind of social upheaval that attempts to cut spending in "sensitive" areas can lead to.”
This is really just the usual litany of aggrieved complaints borne of false assumptions that describe a completely different world than the one we are living in.
The idea that people are enjoying generous “entitlements” is delusional. The reality of social assistance for people who are unable to work because they are chronically ill, disabled, physically or mentally injured is not enough to live on. In many provinces, it is not much different than it was in 1986, nearly 40 years ago.
And it cannot be said often enough, that the decisions made by government - especially entitlements - are decisions that make the difference between whether people live or people die. It makes the difference between whether they get health care or not, whether they can eat, afford life-saving medication, or have a roof over their head. It has an impact on jobs, wages, incomes and private sector business activity. As Mark Blyth spelled out in his outstanding book “Austerity: History of a Dangerous Idea” austerity never works, and it leads to nasty politics. The solutions that Athanassakos is recommending are recipes for how government can engineer a recession.
When Athanassakos talks about politics, is oblivious to the reality that decisions at every level of government make a difference in whether citizens live or die. Legally and constitutionally, the only institution that has the responsibility and the capacity to make these decisions are governments. If politicians fail to act in the public interest, no one will, and the public suffers as a consequence.
He suggests that social unrest is being generated by the threat of cuts, when massive cuts to health, education, infrastructure, the military, research and development have already taken place for decades.
The idea seems to be that politicians are afraid of complaints, and not the consequences that withdrawing aid that people depend on to live means they will die. I am not saying this to be dramatic: this is the reality of governing.
Athannakos says:
“For political reasons, the option that may be the most viable and the solution of least resistance, is starting up the money printing presses and inflating the debt away. This fits well with my recent writings on the increasing possibility of a world with slow growth and higher inflation.”
Athannakos’ is relying on Milton Friedman’s argument for inflation, which is a pure thought experiment that imagines a world without debt where machines never break down or need maintenance or replacing.
“For investors, this has serious implications. The value of paper currencies will be worth less and holding cash and bonds (except for real return bonds) in one's portfolio will not make one secure and wealthy. Stocks will do better, particularly those of companies in good businesses with global reach that have pricing power. And so will investing in gold. Moreover, the possibility of higher taxes is also inflationary. They are inflationary as investors demand higher before-tax returns in their bond portfolios and workers demand higher before-tax wages to make up for the higher taxes.”
It has to be said that conclusions Athannakos draws are in question, and sometimes contradictory. According to his own argument, government putting money into the economy is inflationary - but so is government taking money out of the economy.
Workers are not asking for raises because they think a future tax increase will cause inflation, but because they living under the poverty line and are on the verge of insolvency.
“So, get used to it and get ready. Higher taxes and higher inflation will be the name of the game in the future. Both are unavoidable and are the effect of rich citizens and poor countries.”
The threat to Canada and investors is not higher taxes and inflation: it is a massive recession and possible financial crisis driven by defaults in private debt, driven by more than a generation of neoclassical monetary and fiscal policy that has led to a massive asset bubble that is global in scope that is bankrupting the working and middle classes in developed nations.
China is menacing Taiwan; Russia is at war with Ukraine, and there is anger and division across the developed world because the very same debt that has been racked up by governments and the private sector have fuelled the asset growth and wealth of the wealthiest people in the world - including in India, Russia and China. We are living in a return to a world rules by criminal oligarchs.
The global market has been turned into a multi-trillion dollar casino where the high-rollers are covered, win or lose, and everyone else is expected to go into more debt to cover their losses.
What investors need to ask is “are you willing to put up with higher taxes and inflation if it helps rebalance the economy, avoids a Second Great Depression and World War III, and secure Canada’s place as a stable, prosperous and democratic country with the rule of law?” Because that is what is at stake.
-30-
A fine and finely reasoned analysis but you didn’t answer the really interesting question: why IS the G&M publishing delusional assessments of the economy?
Nice piece! I am writing some essays to 1. Debunk the power law hypothesis. I am a complexity thinker & I go back to first principles to show they are wrong. Power laws are not the natural order. They describe the behaviour of *individual* systems going through creation > destruction cycles. But ecosystems use all the ‘small collapses’ of individual cycles to distribute resources efficiently. An ecosystem grows slowly but abundantly. It creates more thermodynamic *work* than one big, joined up energy guzzling system. And it lasts longer. This is the flaw at the centre of our economic understanding- to believe that monopoly & oligarchy are the natural order. That they generate optimal outcomes. They don’t. If this were true, we wouldn’t have ecosystems. We’d just have a plague of locusts consuming everything all at once & collapsing complex life. 2. The lie about public debt being caused by welfare spending is an utter travesty. The liberal press are utterly complicit here for not strenuously challenging this narrative every time it’s uttered. Again, in an ecosystem there’s no such thing as ‘welfare’. There’s just lots of abundant things held in a dynamic (not static) equilibrium with collapses creating energy gradients for new growth. It’s not equality but it’s more of a Gaussian, ergodic distribution of resources. This is why it doesn’t consolidate & collapse. 3. I’m using these essays to point to a 3rd way. *NOT* the Clinton / Blairite neoliberal nonsense but something that is grounded in complexity science & cybernetics. The third way I am going to propose can pay off the debt, protect domestic economies, break the runaway consumption > production feedback loop, firewall the casino & generate ecosystem level abundance. It is not redistribution. It is not Left vs Right. It is stocks & flows & cybernetic system balancing. It’s also very difficult - but I don’t think it’s impossible.
I’m hoping to seed a new conversation on the Left - away from tax the rich (which is impossible for the ultra rich & looks more like austerity for middle classes) & towards diagnosing the real problem - which is the runaway feedback loop - and how to fix it. We desperately need Left voices that can see the whole system & not just parts. On which, MMT is fine in a domestic economy but the big problem is the exchange price of the currency in international markets. That is a huge problem for trade deficit countries that must be reflected. I have a way to reconcile MMT with currency exchange prices. It will hurt to begin with but eventually we’ll get what we need - which is strong, healthy, sovereign, domestic economies trading freely with other economies.